Abstract: Background: While toothbrushing remains the primary technique recommended for mechanically removing plaque above the gumline, it often leaves interproximal plaque unaddressed. Cetylpyridinium chloride (CPC) is a well-known antibacterial for use in mouthwash formulas, demonstrated to successfully reduce plaque and gingivitis throughout the mouth. There is evidence, however, that the addition of zinc lactate to the formula increases its efficacy in vivo. Methods: A randomized, single-center, three-arm, examiner-blind, parallel-group clinical trial was conducted over 6 weeks in the Dominican Republic to assess the efficacy of two alcohol-free mouthwashes containing (1) 0.075% CPC, 0.28% zinc lactate, and 0.05% sodium fluoride (CPC + Zn) and (2) 0.075% CPC and 0.05% sodium fluoride (CPC) compared to a fluoride-free, alcohol-free placebo mouthwash on established dental plaque and gingivitis. One hundred and sixteen participants took part in the phase III clinical study. The Stewart Quantification Plaque Index was used to measure whole mouth, interproximal, gumline, and severity for plaque, and the Löe-Silness Gingival Index was used to measure whole mouth, interproximal, and bleeding for the gingiva. Results: All plaque and gingivitis scores improved statistically significantly (P < .05) for both the CPC + Zn and CPC treatment groups for all timepoints compared to the placebo group. After 6 weeks, the CPC + Zn treatment group showed statistically significantly (P < .05) greater reductions of 16.1% in whole-mouth plaque index, 16.4% in interproximal plaque, 9.4% in gumline plaque, 27.0% in plaque severity, 13.2% in whole-mouth gingival index, 14.8% in interproximal gingivitis, and 28.6% in gingival bleeding compared to the CPC treatment group. Conclusions: These results demonstrated that both the CPC + Zn and CPC-only mouthwashes significantly reduced established dental plaque and gingivitis compared to a fluoride-free, alcohol-free placebo mouthwash after 4 and 6 weeks. Importantly, the CPC + Zn mouthwash provided significantly greater reductions in all measured indices after 4 and 6 weeks compared to the CPC-only mouthwash. Practical Implications: The alcohol-free CPC + Zn mouthwash studied here is a superior option when choosing an alcohol-free mouthrinse for control of plaque and gingivitis.
While toothbrushing remains the primary technique recommended for mechanically removing plaque above the gumline, it often leaves interproximal plaque unaddressed.1 The addition of a mouthwash to the oral care regimen can greatly impact the management of oral health by reducing plaque biofilms.2 Using antibacterial mouthwash specifically in conjunction with toothbrushing has been demonstrated to successfully reduce interproximal plaque and gingivitis throughout the mouth.3-5 Cetylpyridinium chloride (CPC) is a well-known antibacterial ingredient in many mouthwashes and is recognized as safe and effective for use against plaque and gingivitis in the US Food and Drug Administration’s 2003 Advance Notice of Proposed Rulemaking for Over-the-Counter Antigingivitis/Antiplaque Drug products, based on the recommendation of the Dental Plaque Subcommittee of the Nonprescription Drugs Advisory Committee.6,7
The present study focuses on CPC, a quaternary ammonium compound whose amphiphilic properties disrupt the bacterial cell membrane, resulting in antimicrobial efficacy against plaque.8 A recent review highlighting the efficacy of CPC mouthwash against interproximal plaque and gingival inflammation included studies with CPC levels ranging from 0.05% to 0.075% and all eight studies found that CPC demonstrated significantly better results than the control tested.3 However, most of the studies tested mouthwash featuring CPC alone compared to a mouthwash with or without fluoride.
This clinical trial evaluated the antiplaque and antigingivitis efficacy of a mouthwash formula containing 0.075% CPC and 0.28% zinc lactate in an alcohol-free base (CPC + Zn) versus a mouthwash with 0.075% CPC in an alcohol-free base (CPC) and a fluoride-free and alcohol-free placebo mouthwash. The addition of zinc salt to enhance oral care formulations has been seen previously with evidence that zinc salt acts in a compounding manner to antimicrobial properties.9-11 Previous research in vitro supports the evidence that CPC + Zn combats pathogens associated with periodontal disease without destroying the healthy balance of the oral microbiome.12 The addition of zinc lactate to the formula also increased its efficacy in vivo, as evidenced by a 54.5% greater reduction in gingivitis severity after 6 weeks of use compared to a mouthwash formula containing 0.07% CPC alone.13 Of note, zinc has been shown to combat halitosis-associated bacteria as a clinically effective additive against oral malodor.14,15
Therefore, the authors hypothesize that CPC + Zn mouthwash will be significantly better at reducing plaque and gingivitis compared to both the CPC mouthwash and the placebo due to the addition of zinc lactate. These results suggest that the alcohol-free CPC + Zn mouthwash studied here may be a superior option when choosing an alcohol-free mouthrinse for control of plaque and gingivitis.
Materials and Methods
Interventions
1. A 0.075% CPC, 0.28% zinc lactate, and 0.05% sodium fluoride mouthwash in an alcohol-free base (CPC + Zn) (Colgate-Palmolive Co., colgatepalmolive.com).
2. A 0.075% CPC and 0.05% sodium fluoride mouthwash in an alcohol-free base (CPC) (Colgate-Palmolive Co.).
3. A placebo mouthwash in a fluoride-free, alcohol-free base.
Study Design
To assess the clinical antiplaque and antigingivitis efficacy of a mouthwash containing CPC + Zn compared to a mouthwash with just CPC and a placebo mouthwash, 120 adult male and female individuals with established dental plaque and gingivitis were recruited for a 6-week, three-cell, parallel-group, randomized clinical trial conducted at a single site in the Santo Domingo, Dominican Republic, area. Adverse events were noted by the study coordinator through participant interview and dental examination. The study was reviewed and approved by Consejo Nacional de Bioética en Salud Av. Bolívar No. 902, Santo Domingo, República Dominicana, Dentro de la Universidad Católica Santo Domingo.
Inclusion Criteria: For inclusion in the study, participants had to: (1) be between the ages of 18 and 70; (2) be available for the full duration of the study; (3) have ≥20 uncrowned permanent teeth (excluding third molars); (4) have an average whole-mouth plaque score of ≥1.5 on the Stewart Quantification Plaque Index when enrolled; (5) have an average whole-mouth gingivitis score of ≥1.0 on the Löe-Silness Gingival Index when enrolled.
Exclusion Criteria: Individuals were excluded from this study if they: (1) had periodontal disease, ≥5 decayed dental sites, tumors of the soft or hard oral tissue; (2) were taking antimicrobial medication and/or medication that affected salivary flow within 1 month of study start date; (3) were pregnant or lactating; (4) were enrolled in another clinical study within 1 week of study start date; (5) had a history of allergies to oral care products or ingredients or a medical condition that prohibited eating and drinking for periods up to 4 hours.
Randomization and Blinding: Random assignment of qualified participants was performed by first providing a chronological identification number then assigning a treatment group with a computer-generated randomization list. Neither examiner, study site personnel, statistician, nor participant was informed of product allocation. To further ensure blinding, white paper concealed all products, and label information was limited to a code number corresponding to mouthwash, instructions, and safety information.
Study Protocol
Participants were asked to refrain from all oral hygiene practices for 12 hours and eating, drinking, or smoking for 4 hours prior to baseline assessment. A soft-bristled manual toothbrush and a 6-oz tube of a commercially available fluoride toothpaste were provided to the patient to use in addition to the mouthwash treatment. Instructions stated that participants were required to brush for 1 minute in the morning and in the evening, followed by rinsing for 30 seconds with 20 mL of assigned mouthwash each time. Participants were asked to refrain from flossing, using interdental stimulators, or eating/drinking for 30 minutes after rinsing.
Dental plaque scores were assigned according to the Stewart Quantification Plaque Index.16 Dental plaque was dyed with a red/blue disclosing solution and scored at the maxillary and mandibular surfaces on each tooth using a dental light and mirror. Whole-mouth plaque score was calculated by adding all the scores from each scoreable surface and dividing by the total number of scoreable surfaces. Interproximal, gumline, and severity scores were calculated by dividing the tooth into nine zones and quantifying each zone as: 0 = no plaque; 1 = separate flecks of plaque covering less than one third of the surface; 2 = plaque covering one third but less than two thirds of the surface; 3 = plaque covering two thirds or more of the surface. The gumline was referred to as zones A, B, and C, which were added and divided by the number of surfaces. Interproximal regions were regarded as D and F. Severity was determined by adding all zones scored as 2 or 3 and dividing by the number of surfaces.
Gingival inflammation scores were assigned according to the Löe-Silness Gingival Index.17,18 Scoring was performed at six sites: distobuccal, midbuccal, mesiobuccal, distolingual, midlingual, and mesiolingual. Whole-mouth gingivitis score was calculated by adding all scores from each scoreable surface and dividing by the total number of scoreable surfaces. Interproximal scores were the addition of the mesial and distal scores divided by the number of mesial and distal surfaces. Bleeding scores were the addition of the 2 and 3 scores divided by the total number of surfaces scored.
Statistical Analysis
Statistical analysis was performed as stated in Stewart et al.19 In brief, sample size was determined for an attrition rate of 10% and power of 80%, a significance of α = 0.05, and response measure of 0.58. The per protocol population was analyzed.
Results
Trial Participants
Of the 120 individuals accepted into the study based on inclusion criteria, 116 participants completed all 6 weeks (Figure 1). One-hundred-sixteen participants were randomized into the CPC + Zn treatment group (n = 40; female = 20), the CPC treatment group (n = 39; female = 20), and the placebo group (n = 37; female = 18). The age range for the CPC + Zn group was 21 to 63 (mean: 35.3). The age range for the CPC group was 20 to 56 (35.3). The age range for the placebo group was 21 to 56 (33.1). There was no statistically significant difference between gender (P > .05 ) or age (P > .05 ) across the three treatment groups (Table 1). No adverse events were reported.
Plaque Index Analysis
Within-Treatment Comparison to Baseline
Mean whole-mouth plaque index scores statistically significantly decreased by 26.5% (P < .05) after 4 weeks and by 33.3% (P < .05) after 6 weeks of treatment with CPC + Zn mouthwash compared to baseline (Figure 2 A). Mean whole-mouth plaque index scores significantly decreased by 16.9% (P < .05) after 4 weeks and by 24.7% (P < .05) after 6 weeks of treatment with CPC mouthwash compared to baseline. Mean whole-mouth plaque index scores did not statistically significantly decrease after 4 weeks or 6 weeks of treatment with placebo mouthwash compared to baseline.
Mean interproximal plaque index scores statistically significantly decreased by 26.2% (P < .05) after 4 weeks and by 36.2% (P < .05) after 6 weeks of treatment with CPC + Zn mouthwash compared to baseline (Figure 2 B). Mean interproximal plaque index scores statistically significantly decreased by 15.6% (P < .05) after 4 weeks and by 24.3% (P < .05) after 6 weeks of treatment with CPC mouthwash compared to baseline. Mean interproximal plaque index scores statistically significantly decreased by 4.4% (P < .05) after 4 weeks and by 4.1% (P < .05) after 6 weeks of treatment with placebo mouthwash compared to baseline.
Mean gumline plaque index scores statistically significantly decreased by 9.7% (P < .05) after 4 weeks and by 12.5% (P < .05) after 6 weeks of treatment with CPC + Zn mouthwash compared to baseline (Figure 2 C). Mean gumline plaque index scores statistically significantly decreased by 3.7% (P < .05) after 4 weeks and by 7.6% (P < .05) after 6 weeks of treatment with CPC mouthwash compared to baseline. Mean gumline plaque index scores statistically significantly increased by 8.2% (P < .05) after 4 weeks and by 10.5% (P < .05) after 6 weeks of treatment with placebo mouthwash compared to baseline.
Mean plaque severity scores statistically significantly decreased by 35.6% (P < .05) after 4 weeks and by 44.4% (P < .05) after 6 weeks of treatment with CPC + Zn mouthwash compared to baseline (Figure 2 D). Mean plaque severity scores statistically significantly decreased by 20.7% (P < .05) after 4 weeks and by 29.9% (P < .05) after 6 weeks of treatment with CPC mouthwash compared to baseline. Mean plaque severity scores statistically significantly increased by 4.3% (P < .05) after 4 weeks and by 9.8% (P < .05) after 6 weeks of treatment with placebo mouthwash compared to baseline.
Between-Treatment Comparison
The CPC + Zn treatment group showed a statistically significant 16.1% greater reduction (P < .05) in whole-mouth plaque index scores after 4 weeks and 6 weeks of treatment compared to the CPC treatment group (Figure 2 A). Compared to the placebo treatment group, the CPC + Zn group had a 29.1% (P < .05) and a 36.5% (P < .05) statistically significantly greater reduction in whole-mouth plaque index after 4 weeks and 6 weeks of treatment, respectively. The CPC treatment group had a 15.4% (P < .05) and a 24.3% (P < .05) statistically significantly greater reduction in whole-mouth plaque index compared to the placebo group after 4 weeks and 6 weeks of treatment, respectively.
The CPC + Zn treatment group showed a statistically significant 13.4% greater reduction (P < .05) in interproximal plaque scores after 4 weeks and a 16.4% greater reduction (P < .05) after 6 weeks of treatment compared to the CPC treatment group (Figure 2 B). Compared to the placebo treatment group, the CPC + Zn group had a 22.4% (P < .05) and a 33.0% (P < .05) statistically significantly greater reduction in interproximal plaque after 4 weeks and 6 weeks of treatment, respectively. The CPC treatment group had a 10.4% (P < .05) and a 19.9% (P < .05) statistically significantly greater reduction in interproximal plaque compared to the placebo group after 4 weeks and 6 weeks of treatment, respectively.
The CPC + Zn treatment group showed a statistically significant 10.3% greater reduction (P < .05) in gumline plaque scores after 4 weeks and a 9.4% greater reduction (P < .05) after 6 weeks of treatment compared to the CPC treatment group (Figure 2 C). Compared to the placebo treatment group, the CPC + Zn group had a 18.2% (P < .05) and a 22.5% (P < .05) statistically significantly greater reduction in gumline plaque after 4 weeks and 6 weeks of treatment, respectively. The CPC treatment group had a 8.8% (P < .05) and a 14.5% (P < .05) statistically significantly greater reduction in gumline plaque compared to the placebo group after 4 weeks and 6 weeks of treatment, respectively.
The CPC + Zn treatment group showed a statistically significant 25.4% greater reduction (P < .05) in plaque severity scores after 4 weeks and a 27.0% statistically significantly greater reduction (P < .05) after 6 weeks of treatment compared to the CPC treatment group (Figure 2 D). Compared to the placebo treatment group, the CPC + Zn group had a 39.8% (P < .05) and a 50.6% (P < .05) statistically significantly greater reduction in plaque severity after 4 weeks and 6 weeks of treatment, respectively. The CPC treatment group had a 19.3% (P < .05) and a 32.2% (P < .05) statistically significantly greater reduction in plaque severity compared to the placebo group after 4 weeks and 6 weeks of treatment, respectively.
Gingival Index Analysis
Within-Treatment Comparison to Baseline
Mean whole-mouth gingival index scores statistically significantly decreased by 18.1% (P < .05) after 4 weeks and by 30.0% (P < .05) after 6 weeks of treatment with CPC + Zn mouthwash compared to baseline (Figure 3 A). Mean whole-mouth gingival index scores statistically significantly decreased by 9.9% (P < .05) after 4 weeks and by 19.9% (P < .05) after 6 weeks of treatment with CPC mouthwash compared to baseline. Mean whole-mouth gingival index scores statistically significantly increased by 2.0% (P < .05) after 4 weeks and by 4.1% (P < .05) after 6 weeks of treatment with placebo mouthwash compared to baseline.
Mean interproximal gingivitis scores statistically significantly decreased by 19.9% (P < .05) after 4 weeks and by 32.7% (P < .05) after 6 weeks of treatment with CPC + Zn mouthwash compared to baseline (Figure 3 B). Mean interproximal gingivitis scores statistically significantly decreased by 10.5% (P < .05) after 4 weeks and by 21.1% (P < .05) after 6 weeks of treatment with CPC mouthwash compared to baseline. Mean interproximal gingivitis scores statistically significantly increased by 2.5% (P < .05) after 4 weeks but did not significantly increase or decrease after 6 weeks of treatment with placebo mouthwash compared to baseline.
Mean gingival bleeding scores statistically significantly decreased by 32.7% (P < .05) after 4 weeks and by 49.0% (P < .05) after 6 weeks of treatment with CPC + Zn mouthwash compared to baseline (Figure 3 C). Mean gingival bleeding scores statistically significantly decreased by 15.2% (P < .05) after 4 weeks and by 23.9% (P < .05) after 6 weeks of treatment with CPC mouthwash compared to baseline. Mean gingival bleeding scores statistically significantly increased by 10.5% (P < .05) after 4 weeks and by 21.1% (P < .05) after 6 weeks of treatment with placebo mouthwash compared to baseline.
Between-Treatment Comparison
The CPC + Zn treatment group showed a statistically significant 9.7% greater reduction (P < .05) in whole-mouth gingival index scores after 4 weeks and a 13.2% greater reduction (P < .05) after 6 weeks of treatment compared to the CPC treatment group (Figure 3 A). Compared to the placebo treatment group, the CPC + Zn group had a 12.7% (P < .05) and a 26.8% (P < .05) statistically significantly greater reduction in whole-mouth gingival index after 4 weeks and 6 weeks of treatment, respectively. The CPC treatment group had a 3.3% (P < .05) and a 15.7% (P < .05) greater reduction in whole-mouth gingival index compared to the placebo group after 4 weeks and 6 weeks of treatment, respectively.
The CPC + Zn treatment group showed a statistically significant 10.5% greater reduction (P < .05) in interproximal gingivitis scores after 4 weeks and a 14.8% greater reduction (P < .05) after 6 weeks of treatment compared to the CPC treatment group (Figure 3 B). Compared to the placebo treatment group, the CPC + Zn group had a 14.9% (P < .05) and a 29.9% (P < .05) statistically significantly greater reduction in interproximal gingivitis after 4 weeks and 6 weeks of treatment, respectively. The CPC treatment group had a 5.0% (P < .05) and a 17.7% (P < .05) greater reduction in interproximal gingivitis compared to the placebo group after 4 weeks and 6 weeks of treatment, respectively.
The CPC + Zn treatment group showed a statistically significant 15.4% greater reduction (P < .05) in gingival bleeding scores after 4 weeks and a 28.6% greater reduction (P < .05) after 6 weeks of treatment compared to the CPC treatment group (Figure 3 C). Compared to the placebo treatment group, the CPC + Zn group had a 21.4% (P < .05) and a 45.7% (P < .05) statistically significantly greater reduction in gingival bleeding after 4 weeks and 6 weeks of treatment, respectively. The CPC treatment group had a 7.1% (P < .05) and a 23.9% (P < .05) greater reduction in gingival bleeding compared to the placebo group after 4 weeks and 6 weeks of treatment, respectively.
Discussion
This 6-week study demonstrated the superiority of CPC + Zn mouthwash in treating individuals with established dental plaque and gingivitis compared to mouthwash containing CPC alone or rinsing with a fluoride-free, alcohol-free placebo mouthwash. Both CPC + Zn and CPC treatments significantly reduced plaque and gingivitis across all indices compared to baseline and the placebo treatment. However, the CPC + Zn treatment provided significantly greater reductions at 4 weeks than the CPC treatment was able to achieve even after 6 weeks.
The results of this study are similar to a previously published 6-week plaque and gingivitis clinical trial comparing the same CPC + Zn mouthwash with a 0.07% CPC and 0.05% sodium fluoride mouthwash.13 After 6 weeks, Rösing et al observed a 16.8% greater reduction in whole-mouth plaque index and a 14.3% greater reduction in whole-mouth gingival index for CPC + Zn compared to the 0.07% CPC mouthwash, which is comparable to the 16.1% and 13.2% seen in this study, respectively. However, mean gingival bleeding scores, which were referred to as gingival severity in Rösing et al, were reduced 28.6% by the CPC + Zn mouthwash in this study and 54.5% in the Rösing et al study compared to the CPC-alone group. This discrepancy could be due to the CPC-alone mouthwash in this study containing 0.075% CPC as opposed to 0.07% CPC as in the Rösing et al study. A lower percentage of the active ingredient could result in a greater difference between the two test groups, but more likely the difference may be due to formulation differences or difference in study populations.
The inclusion of zinc lactate in this CPC mouthwash formulation enhanced the antiplaque and antigingivitis efficacy of CPC. The addition of a zinc salt to enhance oral care formulations has been seen previously. Brading et al in 2003 showed that a 0.3% triclosan toothpaste with added zinc citrate had superior antimicrobial efficacy compared to a 0.3% triclosan toothpaste alone.9 A small SARS-CoV-2 study found that 0.075% CPC plus 0.28% zinc lactate mouthwash treatment showed a greater reduction in viral load in saliva after immediate use and 30 minutes compared to a 0.075% CPC-alone mouthwash.10 In addition, a recent study found that the addition of zinc lactate to an amine/fluoride mouthwash increased the long-term antibacterial activity.11
Conclusion
This clinical trial was designed to evaluate the antiplaque and antigingivitis efficacy of a CPC + Zn mouthwash compared to a CPC-only mouthwash and a placebo mouthwash with no active ingredients. The authors hypothesized that the CPC + Zn would be superior in reducing plaque and gingivitis significantly compared to both the CPC-only mouthwash and the placebo due to the addition of zinc lactate. The results of the trial fully supported this hypothesis. Therefore, the alcohol-free CPC + Zn mouthwash studied here is a viable option when choosing an alcohol-free mouthwash for control of plaque and gingivitis.
ACKNOWLEDGMENTS
Technical writing was provided by Meghan A. Berryman, PhD. The author contributions were as follows: BS and BG: conceptualization, funding acquisition, supervision; LM: formal analysis, validation; JN and AE: project administration, investigation. All authors contributed to writing, review, and editing.
DISCLOSURES
This clinical trial was supported by funding from the Colgate-Palmolive Company. Institutional Review Board Approval: The study was reviewed and approved by Consejo Nacional de Bioética en Salud (CONABIOS) Av. Bolívar No. 902, Santo Domingo, República Dominicana, Dentro de la Universidad Católica Santo Domingo.
DATA AVAILABILITY
The documents containing the results of the research herein described are confidential. The authors confirm that the data supporting the findings of this study are available within the article and/or its supplementary materials.
ABOUT THE AUTHORS
Bernal Stewart, MSc
Director Clinical Research and Innovation, Colgate-Palmolive Co., Piscataway, New Jersey
Bayardo García-Godoy, DMD, MSc
Director Clinical Research, Colgate-Palmolive Co., Piscataway, New Jersey
Luis R. Mateo, MA
President, LRM Statistical Consulting LLC, West Orange, New Jersey
Joselyn Noboa, DDS
Dentist, Dental Research Associates, Santo Domingo, Dominican Republic
Augusto R. Elias-Boneta, DMD, MSD
Assistant Dean for Research, School of Dental Medicine, University of Puerto Rico, San Juan, Puerto Rico
References
1. Sreenivasan PK, Prasad KVV. Distribution of dental plaque and gingivitis within the dental arches. J Int Med Res. 2017;45(5):1585-1596.
2. McGrath C, Clarkson J, Glenny AM, et al. Effectiveness of mouthwashes in managing oral diseases and conditions: do they have a role? Int Dent J. 2023;73 suppl 2(suppl 2):S69-S73.
3. Langa GPJ, Muniz FWMG, Costa RDSA, et al. The effect of cetylpyridinium chloride mouthrinse as adjunct to toothbrushing compared to placebo on interproximal plaque and gingival inflammation–a systematic review with meta-analyses. Clin Oral Investig. 2021;25(2):745-757.
4. Gunsolley JC. Clinical efficacy of antimicrobial mouthrinses. J Dent. 2010;38 suppl 1:S6-S10.
5. Mythri H, Ananda SR, Prashant GM, et al. The efficacy of antiseptic mouth rinses in comparison with dental floss in controlling interproximal gingivitis. J Int Soc Prev Community Dent. 2011;1(1):31-35.
6. Depaola LG, Spolarich AE. Safety and efficacy of antimicrobial mouthrinses in clinical practice. Am Dent Hyg Assoc. 2007;81(suppl 1):117.
7. Oral Health Care Drug Products for Over-the-Counter Human Use; Antigingivitis/Antiplaque Drug Products; Establishment of a Monograph. 68 Fed Reg 32232. May 29, 2003. https/www.govinfo.gov/content/pkg/FR-2003-05-29/pdf/03-12783.pdf.
8. Dumitrel SI, Matichescu A, Dinu S, et al. New insights regarding the use of relevant synthetic compounds in dentistry. Molecules. 2024;29(16):3802.
9. Brading MG, Cromwell VJ, Jones NM, et al. Anti-microbial efficacy and mode of action studies on a new zinc/Triclosan formulation. Int Dent J. 2003;53(6 suppl 1):363-370.
10. Bezinelli LM, Corrêa L, Beyerstedt S, et al. Reduction of SARS-CoV-2 viral load in saliva after rinsing with mouthwashes containing cetylpyridinium chloride: a randomized clinical study. PeerJ. 2023;11:e15080.
11. Schaeffer LM, Yang Y, Daep C, et al. Antibacterial and oral tissue effectiveness of a mouthwash with a novel active system of amine + zinc lactate + fluoride. Clin Exp Dent Res. 2024;10(4):e874.
12. Torrez WB, Figueiredo LC, Santos TDS, et al. Incorporation of zinc into cetylpyridinium chloride mouthwash affects the composition of multispecies biofilms. Biofouling. 2023;39(1):1-7.
13. Rösing CK, Cavagni J, Gaio EJ, et al. Efficacy of two mouthwashes with cetylpyridinium chloride: a controlled randomized clinical trial. Braz Oral Res. 2017;31:e47.
14. Erovic Ademovski S, Lingström P, Renvert S. The effect of different mouth rinse products on intra-oral halitosis. Int J Dent Hyg. 2016;14(2):117-123.
15. Haraszthy VI, Zambon JJ, Sreenivasan PK. Evaluation of the antimicrobial activity of dentifrices on human oral bacteria. J Clin Dent. 2010;21(4):96-100.
16. Stewart JE, Wolfe GR. The retention of newly-acquired brushing and flossing skills. J Clin Periodontol. 1989;16(5):331-332.
17. Löe H, Silness J. Periodontal disease in pregnancy. I. prevalence and severity. Acta Odontol Scand. 1963;21:533-551.
18. Talbott K, Mandel ID, Chilton NW. Reduction of baseline gingivitis scores with repeated prophylaxes. J Prev Dent. 1977;4(6):28-29.
19. Stewart B, García-Godoy B, Dillon R, et al. Antiplaque and antigingivitis efficacy of mouthwash containing cetylpyridinium chloride and zinc lactate compared to essential oils with alcohol. Compend Contin Educ Dent. 2025;46 suppl 2:25-33.
Figures and Images
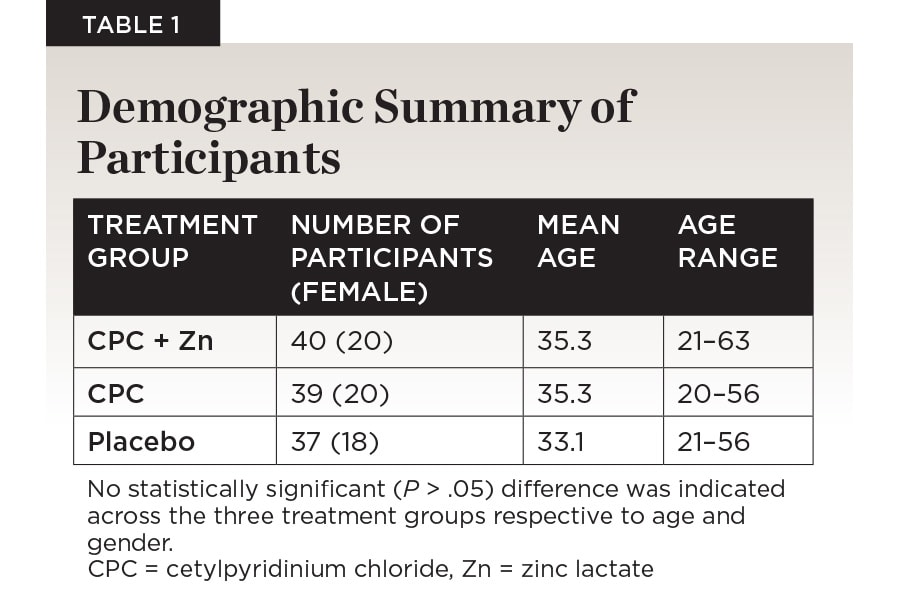
Table 1
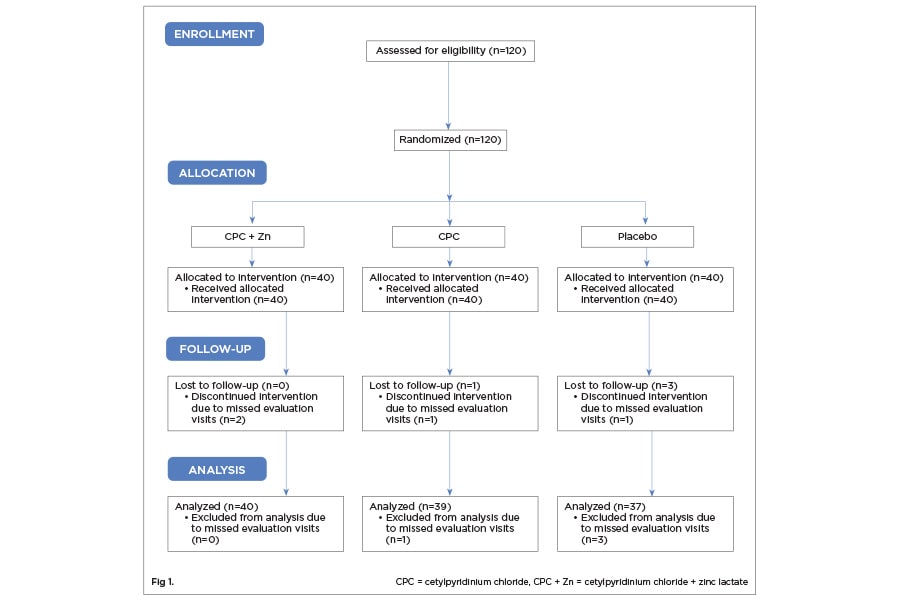
Figure 1
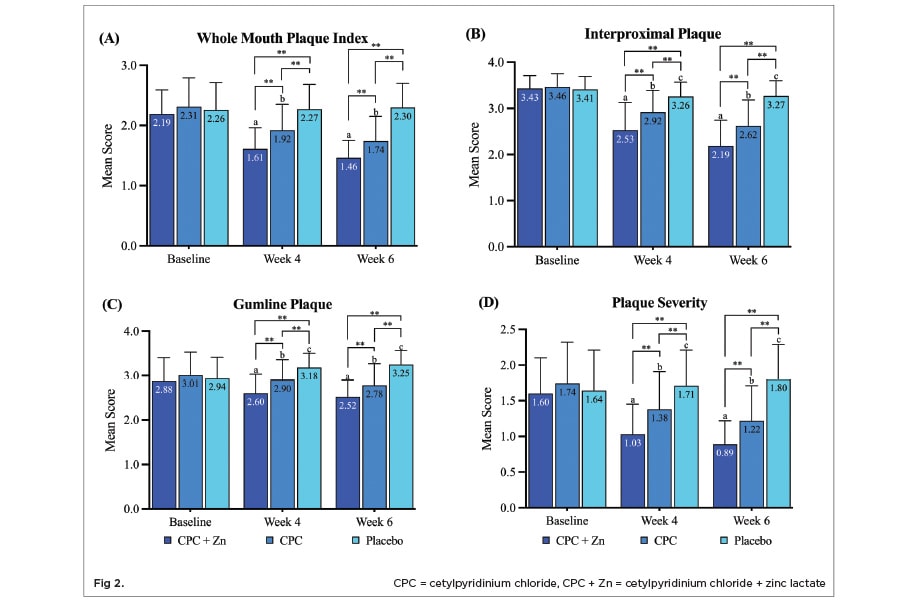
Figure 2
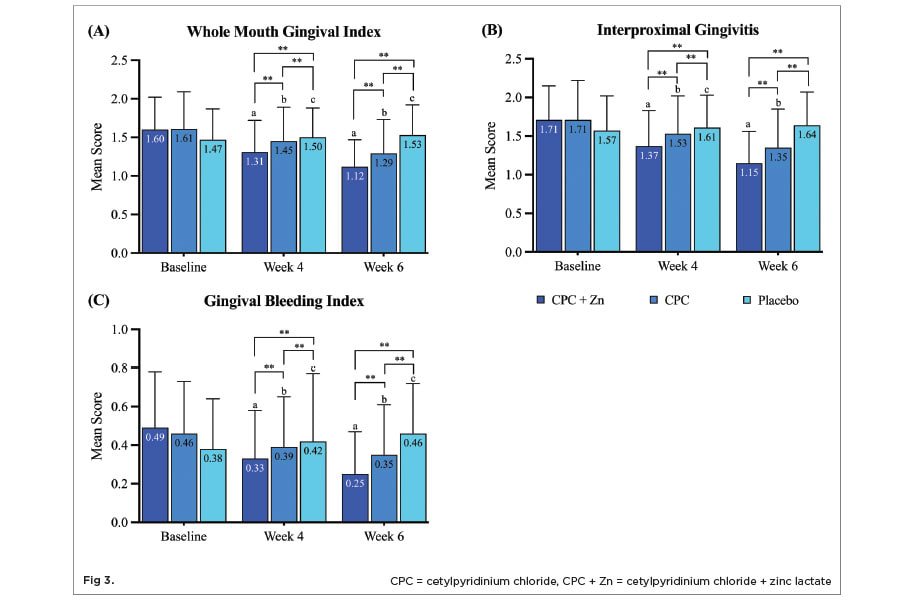
Figure 3
